
That which gets measured gets managed: an Economic Agency Index
Five metrics that measure what matters: people's actual power over their time, money, and democracy.

TLDR
Economic Agency Index Proposal:
Time Sovereignty: Measures what percentage of your waking hours are under your control versus economic obligation (work + commute). Calculated by dividing free waking hours by total waking hours per week. Higher scores indicate more personal freedom and economic progress, especially as automation increases.
Economic Value Capture: Measures how much total economic value is accessible to regular people versus being extracted by distant shareholders. Calculated as a ratio of local economic benefits versus total value generated. Higher scores indicate better distribution of wealth and more investment opportunities for local communities.
Grievance Recourse Power: Measures how easily people can seek justice for economic wrongdoing without facing prohibitive costs. Calculated by examining the accessibility and effectiveness of legal/regulatory recourse. Higher scores indicate better consumer and citizen protections and more balanced power dynamics.
Velocity of Transparency: Measures how quickly important economic information becomes public. Calculated as 1 divided by the number of days until disclosure. Higher scores indicate faster access to market-relevant information and better accountability.
Democratic System Authority: Measures how many significant economic decisions are under democratic control versus unaccountable authorities. Calculated as ratio of democratically controlled economic decisions to total significant economic decisions. Higher scores indicate more responsive and accountable governance.
The Cobra Effect
Back in my last days as a corporate worker, I was hanging out with a colleague named Satish near one of our company’s tech buildings. It was a hot summer day and he’d just told me that there used to be copperheads nearby. Copperheads, in case you don’t know, are one of the few indigenous venomous snakes in North Carolina, and among all venomous snakes, they are sort of the most pathetic.
Copperheads have a brief period in their youth when they are aggressive, but they they get fat and lazy and have big “get off my lawn” energy because they really just want to be left alone. Once, while hiking at the Eno river, my dog Gus was pulling on his lead while I was talking with a friend and I looked over to see him nose-to-nose with a copperhead coiled up on a rock thinking to himself “Ugh, this dipshit dog…” Needless to say I yanked my dog back (he had no idea what he was messing with).
I foolishly asked Satish if copperheads bothered him.
“I mean, in my village in India, we had cobras… so no. Copperheads do not scare me.”
In the mid-19th century, under the British Raj, Delhi implemented a catch-and-kill cobra program. The idea was to reduce the number of cobras in the region, so they put out a “cobra bounty” which paid for dead cobras.
The locals, being somewhat clever and not at all impressed with the British, just started breeding cobras so they could turn in more cobra carcasses. Thus was born the first famous example of perverse incentives where the incentive structure created by a state literally had the exact opposite of its intended effect! The British wanted zero cobras, but it’s impossible to measure total cobra population, so they needed to use a proxy KPI, and by rewarding just “dead cobras” they created a financial incentive to increase the total cobras!
Bugs, Not Features
Now, the Cobra Effect might seem quaint but it has happened several times throughout history. In Hanoi, under French colonial rule, they did the same thing with rats. In the 1990’s, land around Fort Benning in Georgia was at risk of being declared protected land due to the local endangered woodpecker, so a bunch of landowners panicked and cut down all their pine trees to drive away the endangered bird! Another example occurs in the late 1980’s in Mexico city, when they created “no-drive” days to cut down on pollution. The scheme, meant to curb driving, was based on license plate numbers. So what did people do? They bought second cars, often cheaper, older, and worse-polluting cars!
The Cobra Effect is a permanent example of perverse incentives and Goodhart’s law: “when a measure becomes a target, it ceases to be a good measure.”
Here’s one final example: modern software developer teams have to be measured by… something. Coding is this arcane practice of writing computer code and producing software, and it is extremely complex. Some code-bases have millions upon millions of lines of code, and there are bugs everywhere. So you can assume that any developer team will get bug reports from time to time.
At one company I worked at, another Indian fellow we’ll call Sunil pulled me aside one day when I had just started. The company we were working for had just moved into new offices, new management, and everything was being reshuffled. He explained to me, in confidence, that the new leadership had hired some fancy organizational change consultants. One of the things you do when an organization becomes calcified—unofficial power structures prevent change and adaptation, in other words, old relationships create a barrier to management—you shake things up. One of the ways you do that is you change the measurements. This allows you to “prove” that certain teams or managers are ineffective so you can build a case to remove them. I don’t remember the full conversation or the rest of what was discussed, but I’ve seen this pattern many times. New blood comes in, old blood gets grumpy and leaves.
Sunil was still salty about his last job (most tech workers are, tbh) and he told me a story about how his software team (he was now a director) was measured by “bugs resolved” in their code. He talked about how his team wrote good code and had few bugs. His rival’s team, the one who didn’t get fired for “bad code” was incentivized to write a bunch of sloppy code with easy-to-fix bugs. So his rival team, though objectively worse developers, were measured on a bad KPI (resolved bugs) so what did they do? Just like the British Raj, they were rewarded for creating the problem and then solving it!
Measuring Economic Health: GDP?
Remember the last time you went to the doctor? Or, if you’re a hypochondriac like me, the last time you checked your health wearable? My tracks resting heart rate (RHR), heart-rate variably (HRV), my stress levels, my sleep, everything.
If you were to pick one single KPI for estimating your health, what would it be? I would probably pick resting heart rate (RHR). It is highly predictive of long-term survivability. Basically, if your RHR is in the 60’s you have a miniscule chance of having heart disease within the next 10 years. But your doctor would probably check your BMI, your cholesterol, and a bunch of other stuff. Even so, each of these measurements predicts different things and, despite the fact they are all connected to your body, have different implications.
We instrument the economy in the same way. GDP is a composite KPI, meaning it’s not like you go crack out a ruler and measure the economy directly. In health, this is like my “Training Readiness Score” which my Garmin calculates by looking at my recent sleep, stress, and activity levels, some of which are themselves composite scores based on things like HRV fluctuations and heart rate zone minutes and step counts.
Like bodies, the health of the economy has many KPI; unemployment, inflation, consumer confidence, and so on. Economists try and diagnose the economy by observing these numbers and write prescriptions like “increase bond yields” or “lower interest rates.” This is about the same as a doctor saying “you need to eat less” or “you need to exercise more” or “Jesus Christ you’re tired go to bed!”
That last one was actually in my own head.
Right now, the economic doctrine says you should optimize for inflation control above all else. Not 100% employment, and in fact, the powers that be say we should maintain at least a little unemployment, and they use euphemistic language like “labor flexibility”
“If workers are more insecure, that's very healthy for the society, because if workers are insecure they won't ask for wages, they won't strike, and they won't push for benefits.” ~ Alan Greenspan
The reason that we need so many metrics and KPI is because, like humans, you can’t really do a post-mortem on the economy. You can’t just “wait and see” and then after its all said and done, say “Aha! We figured out how health the economy was!” We have to look for heuristics and proxies that signal how healthy our bodies and economies are in real time.
GINI Coefficients and HDI
There are plenty of composite measurements out there. HDI (Human Development Index) has just three sub-KPI: life expectancy, education, and per capita income. These are seen as good proxies for civil progress, technological advancement, industrialization, and economic modernization.
One of the reasons that you create composite KPI is because, unlike the Cobra Effect, it’s a little bit harder to game the system. Likewise, for my health, my composite indicators are generally more useful than just any single KPI. My “Body Battery” at the time of writing was 98 this morning and my Training Readiness was 96. That means my stress has been low, my sleep has been good, and my body is about as ready as it could possibly be! That takes into account my sleep for the last few days, my HRV over the last few days, and a slew of other factors.
The GINI coefficient is a little more arcane to calculate.
The GINI coefficient starts with a simple idea: compare everyone’s income to everyone else’s income. Let’s use a small example of four people. Person A makes $10, Person B makes $20, Person C makes $30, and Person D makes $40.
Next, we find the difference between each person’s income and everyone else's income. Looking at Person A’s income compared to everyone: they make $10 less than Person B, $20 less than Person C, and $30 less than Person D. Then we look at Person B compared to the rest: they make $10 less than Person C and $20 less than Person D. Finally, Person C makes $10 less than Person D. We add up all these differences, giving us a total of 100.
The total difference (100 in our case) captures something important: the more spread out incomes are, the bigger this number gets. If everyone made the same amount, all these differences would be zero. If one person made far more than everyone else, these differences would be very large.
To standardize this into a coefficient between 0 and 1, we divide our total by two things: the number of people squared (16 in our example) and the average income ($25 in our example). This gives us a GINI coefficient of 0.25. The higher the resulting number, the more unequal the incomes are in our population.
These two ideas are great, GINI and HDI, but they leave a lot out.
For instance, the Democrats just lost political control over the country because they ignore economic agency. Sure, GDP and the stock market did fine under them, right? So their corporate donors and wealthy backers were all fat, dumb, and happy!
Thus the DNC was confused when it got slaughtered in the election cycle: “but the economy is doing great under Biden!”
Is it though? This is what happens when you measure the wrong things. Specifically, when you’re “out of touch” as the kids say.

So now I’d like to pitch a new KPI. Several actually, and a composite KPI. One that might help politicians get a better feel for where people are actually at.
I call it the Economic Agency Index. Let’s unpack this.
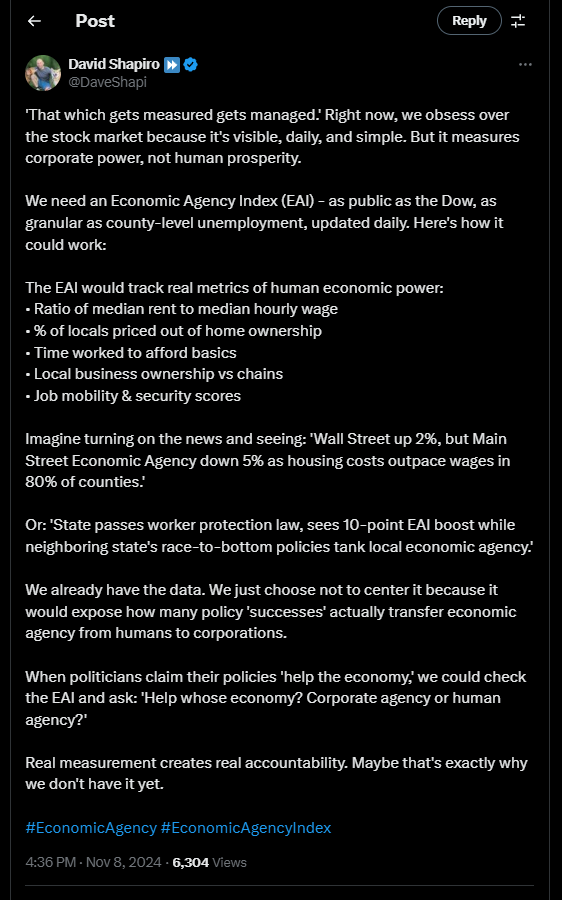
I wrote a tweet about this proposed index that was fairly well received (albeit by a small audience):
There are plenty of ways to slice and dice this framework, but I set myself some acceptance criteria:
Measurable with Existing Data: The index must rely on data that’s already being collected or can be easily gathered through existing systems. This ensures immediate implementation without creating new bureaucracies or waiting for new data collection methods. For example, time spent on economic activities, court case outcomes, and regulatory decisions are already tracked—we just need to analyze them differently.
Policy Actionable: Measurements must directly inform policy decisions at all levels of government. Each metric should point to specific levers that politicians and administrators can pull to improve conditions. Unlike abstract measures like GDP, these metrics should help local councils, state legislatures, and federal agencies make concrete decisions about regulations, protections, and resource allocation.
System Agnostic: The index must work equally well across different political systems, economic models, and technological contexts. Whether measuring a small town in Sweden or a megacity in China, the metrics should capture meaningful data about economic agency without assuming any particular political or economic structure. This ensures global applicability and longevity as systems evolve.
Gaming Resistant: The metrics must be designed to resist manipulation through perverse incentives. By using ratios and multiple interconnected measurements, we make it difficult to game the system without actually improving underlying conditions. This prevents the index from falling prey to Goodhart’s Law, where measured indicators cease to be meaningful.
Jurisdictionally Comparable: Results must be standardized enough to enable meaningful comparison between different jurisdictions. Using 0-1 ratios allows us to compare economic agency between cities, states, or nations regardless of size, wealth, or system of government. This enables both competition and learning between jurisdictions while highlighting successful approaches.
So, without further ado, here’s my (currently) EAI proposal!
Economic Agency Index Proposal
Time Sovereignty
First up is time sovereignty. This is how much of your time you have control over, versus how much time are you under economic obligation. For instance, most metrics don’t capture commute times. These are considered external or incidental to your job. But it is very much valuable time!
One of the best measurements of privilege and economic well-being is how much of your time do you control? To calculate this, I figured simpler is better: you divide your free waking hours by total waking hours on a weekly basis. So let’s say you work a 40-hour work-week and have no commute because you work from home.
There are 112 waking hours in a week (assuming 8 hours of sleep) so that means you have 72 free hours per week. 72 divided by 112 works out to a Time Sovereignty of 64.3% or 0.64. Not bad, right? But let’s say you’re working 12 hour days, because you’re working multiple jobs, plus commutes. The longest I worked when I was in my early 20’s were 16 hour days cleaning carpets. But for round figures, let’s say 60 hours per week. That means you have 52 free hours, divided by 112, for a time sovereignty index of 0.464, which sounds rather miserable.
Now let’s say you’re just working part time, or you’ve got a bullshit job that allows you to slack off, and so you’re just putting in 20 hours per week. Now your time sovereignty score is a whopping 0.821.
The reason I like time sovereignty is because it will naturally adjust upwards as humans get automated out of the workforce (which is the goal of Post-Labor Economics, no?) If you want to get to Fully Automated Luxury Space Communism, one good way to measure that is “How much free time do people have?”
Economic Value Capture
This measurement is a bit more arcane, but here’s the way I think about it: Of all the valuable assets in the world, how many do you have access to? The US stock market represents about 60% of the global wealth. Meaning that for every $10 of global value out there, $6 of those dollars are represented in some stock ticker or another.
However, this often excludes a huge amount of local value, and many people don’t have stock accounts! So how do you measure the level of economic saturation available to people? Unlike time sovereignty, which some people might construe as “systematically measuring laziness” because under neoliberalism, everyone should be maximizing productivity: working the most valuable jobs they can get into, and working themselves to the bone! Measuring economic opportunities to invest should tickle the fancy of traditional neoliberals and Austrians because it represents one of the cardinal principles of the current doctrine: if it’s outside the market, bring it in!
But how can you measure this, particularly on a local level? Instead of just “counting the number of opportunities” it might be better to measure “capturable value ratios.” Here’s what I mean:
Imagine that you live near a mine that generates $100M in profits per year. Now how much of that value is capturable by people other than shareholders? In other words, how much is it actually benefitting real people? Let’s say it’s brining $10M to the local economy in terms of wages, resources, and knock-on effects. That’s a value capture ratio of 0.1 (10%). Not exactly great, is it?
Now you might think “But Dave, if we start optimizing for value capture ratio, we’ll disincentivize investment!”
Yes and no. We’ll disincentivize extractive foreign investment but we’ll actually incentivize local investment. Moreover, we’ll capture how much do people feel like they are being fleeced? This is one reason that people angrily voted Democrats out of office: the fleecing shall continue until moral improves!
Grievance Recourse Power
I have a heart-breaking story. A friend of my wife’s family, someone she grew up playing with as a child, died during a recent routine operation. It was sudden and unexpected. He had an infection in his hand, went in for surgery, and as he was coming out of surgery, his heart stopped. It’s one of those “once in a career” events. My wife’s parents are both physicians, and they said “nothing much you can do in these freak circumstances.” We even talked to another friend, who’d been an ER anesthesiologist. Collectively, they’d seen everything, and this is a bewildering case.
Now, you’d think the hospital would want to get to the bottom of this, right? They’d want to know “who fucked up” or “what did we miss?”
Nope. Once someone dies, it is no longer a medical decision but a financial decision. The hospital decided against doing an autopsy, meaning the family would need to pay for a private autopsy. If they found anything wrong, maybe a toxicology report would show the hospital used the wrong dosage or wrong medication, or maybe the patient had a known defect that was missed in screening—who knows—but it was incumbent upon the family, who just lost one of their breadwinners, to pony up for all that. On the long shot that they had a good case for medical malpractice or wrongful death, it was all up to them.
But the hospital would open itself up to the lawsuit if it conducted the autopsy voluntarily. So what did they do? They washed their hands.
Now, a private autopsy costs $3,000 to $5,000, but then legal fees for wrongful death can get into the tens of thousands or more. The hospital could easily afford this if they were legally required to do so. But this goes to market information. He who controls information can skew the market in their favor. In this case, the relative power ratio is not the worst, but it’s not the best, either. Many families cannot afford to shell out $5k for an emergency, and in this case, a gamble that the person they just lost was the fault of the hospital or its staff.
In a sane world, any time someone dies under the care of a hospital, a third party would always get involved, determine the cause of death and fault, and provide the family recourse. Under neoliberalism, you’re only as free as your dollars will take you, so if you’re a poor family, you’re not really free at all.
Thus, this metric is ratio of economic grievances with recourse and little to no upfront costs. When Chevron dumps billions of gallons of pollutants into the rainforest, and the people spend millions in lawsuits, only to be told “get fucked” after winning, there is no justice. Now, of course, this could result in frivolous lawsuits, but you fix that by making the loser financially responsible if it turns out they were operating in bad faith.
But who will think of the corporations???
The corporations will be fine. They can afford high powered attorneys and the system is stacked in their favor already. It’s time to restack the deck in favor of real families. You know, living, breathing, human beings. And politicians wonder why we’re not having children.
Velocity of Transparency
Here’s another fun one: how long did it take for SCOTUS justice Clarence Thomas’s naked corruption to come to light? He’s been receiving lavish gifts from conservative donors for a while. Justice delayed is justice denied, as they say.
How long did it take for Enron’s scandal to unfold?
In my Post-Labor Economics manifesto, I call for radical transparency and there’s actually a very easy way to measure this: 1 divided by the number of days until disclosure.
The clock starts when an economically important event takes place: could be SCOTUS gifts or it could be a medical examiner’s autopsy report. Then, you calculate how many days it takes to full disclosure.
Let’s take the Clarence Thomas example, where he’s been receiving improper gifts for 20 years, or 7,300 days. That’s a transparency ratio of 0.0001! Big numbers!
Let’s take the case of medical mistakes and autopsies. Typically an autopsy and medical examiner’s report should only take about 24 to 72 hours maximum. So let’s say it’s delayed by a week, total, for political and economic reasons. Seven days. 1 divided by 7 would be a transparency ratio of 0.14. Much better, but not ideal.
However, if we move everything to blockchain and implement radical transparency, then all market-relevant information could be available same day, which would yield a transparency ratio of 1. Right now, we only get quarterly reports from companies, meaning that market-salience information is on average 45 days old, for a ratio of 0.02. Of course, that doesn’t discount Jim Cramer’s clownish antics, though he’s not providing actual market information, only cartoonish entertainment for amateur investors.
Democratic System Authority
Who appointed Clarence Thomas anyways? Is he democratically accountable to anyone? Congress? The people? No, didn’t think so.
We live in a representative democracy which means that we don’t directly vote on everything. Heck, we don’t directly vote on hardly anything. But we can hire and fire politicians, like our Congress and President. Which means they are, hypothetically, accountable to someone. But many of their actions are not accountable, and neither are their appointees.
This “democratic control ratio” is a simple metric: Economic decisions under democratic control / Total significant economic decisions.
Right now, every decision the SCOTUS makes is anti-democratic. There is no accountability and no recourse. Worse, this is the system functioning as intended. Power corrupts and absolute power corrupts absolutely. The theory behind the SCOTUS is that they needed to be above reproach and beyond scrutiny so they would interpret the letter and the spirit of the law in good faith.
Wish in one hand and shit in the other. See which fills up first.
The design of the SCOTUS is perhaps the most boneheaded aspect of the American government. It creates the perfect nest for power-seekers and a very small, easily corrupted target for corporations and others to tip the scales in their favor.
On the other hand, the President and all our Congress can be hired and fired at least every few years. So at least some economic decisions are under democratic control. The more democratic authority we have, the more plastic and responsive the government will be.
Conclusion
I have no idea if this system could work. It would be interesting if a third party agency (not the government) were to create this dashboard and update it weekly or monthly. Particularly if you could drill down into the city and state level. “What is my economic agency index score in this city?” But moreover, it gives us a real set of metrics that we can argue over and optimize for.
Time Sovereignty: We generally want more control over our time, and particularly we want this to trend towards 1.0 as machines replace humans in the labor force. This metric alone is perhaps the best single measurement of technological prosperity. Like measuring resting heart rate, this might be the greatest single measurement of freedom.
Economic Value Capture: If I’m right, and we’re barreling towards a post-labor world, then investment opportunities are going to be critical. This is why I say “seize the means of production and put it on a block chain!” Tokenize and securitize almost everything. Also, remove middle-men and rent-seekers! The more value we can capture as individuals, the better.
Grievance Recourse Power: The FTC just implemented their “click to cancel” policy, meaning “it should be as easy to cancel a service as it was to sign up.” This means it’s way easier for consumers to protect their bank accounts. But those are small potatoes compared to wrongful death lawsuits. Democracy literally means “people power” and it’s high time we put power back in the hands of real people.
Velocity of Transparency: It’s already well accepted and understood that more information and more transparency makes markets more efficient. I feel like that’s enough said.
Democratic System Authority: How robust is your democracy, anyways? Many maps cast America as a “flawed democracy” and our SCOTUS is one shining example as to why. Accountability and transparency go hand in hand. More accountability means a more responsive and adaptive government. The government is here to serve us, the people, not corporations.
But, if we start measuring this stuff, and start taking actions against these metrics to optimize society around them, I suspect people will be happier.
I'm so glad someone who is not an economist is taking to the sham that is GDP. Even Kuznets thought it was a temporary idea.
Lamestream economists just don't get how broken the current measurements are.
Nice! Somebody better call 911 because Dave is bringing the hot fire 🚒🚒🚒
(I wonder what Claude would say to that 😅)